Back to projects
Product Design Case Study

Designing a Personal Health Tracking Platform

How continuous UX iteration transformed a personal need into a product concept.

Product DesignAI Acceleration
Role
Product Designer
Context
Personal project
Focus
Product Design · UX Strategy · AI-assisted prototyping
Tools
Figma · Figma Make · shadcn/ui
Personal Health Tracking Platform — mobile dashboard concept
01

Overview

Like many people trying to build healthier habits, I know that staying consistent is much harder than understanding what I am supposed to do.

So I wanted a single place where I could visualize my progress through clear dashboards, historical data, photos and body measurements. My goal was to make progress visible enough to stay motivated.

What started as a personal project gradually evolved into a broader product design exercise about reducing friction, organizing health information and creating a more engaging long-term tracking experience.

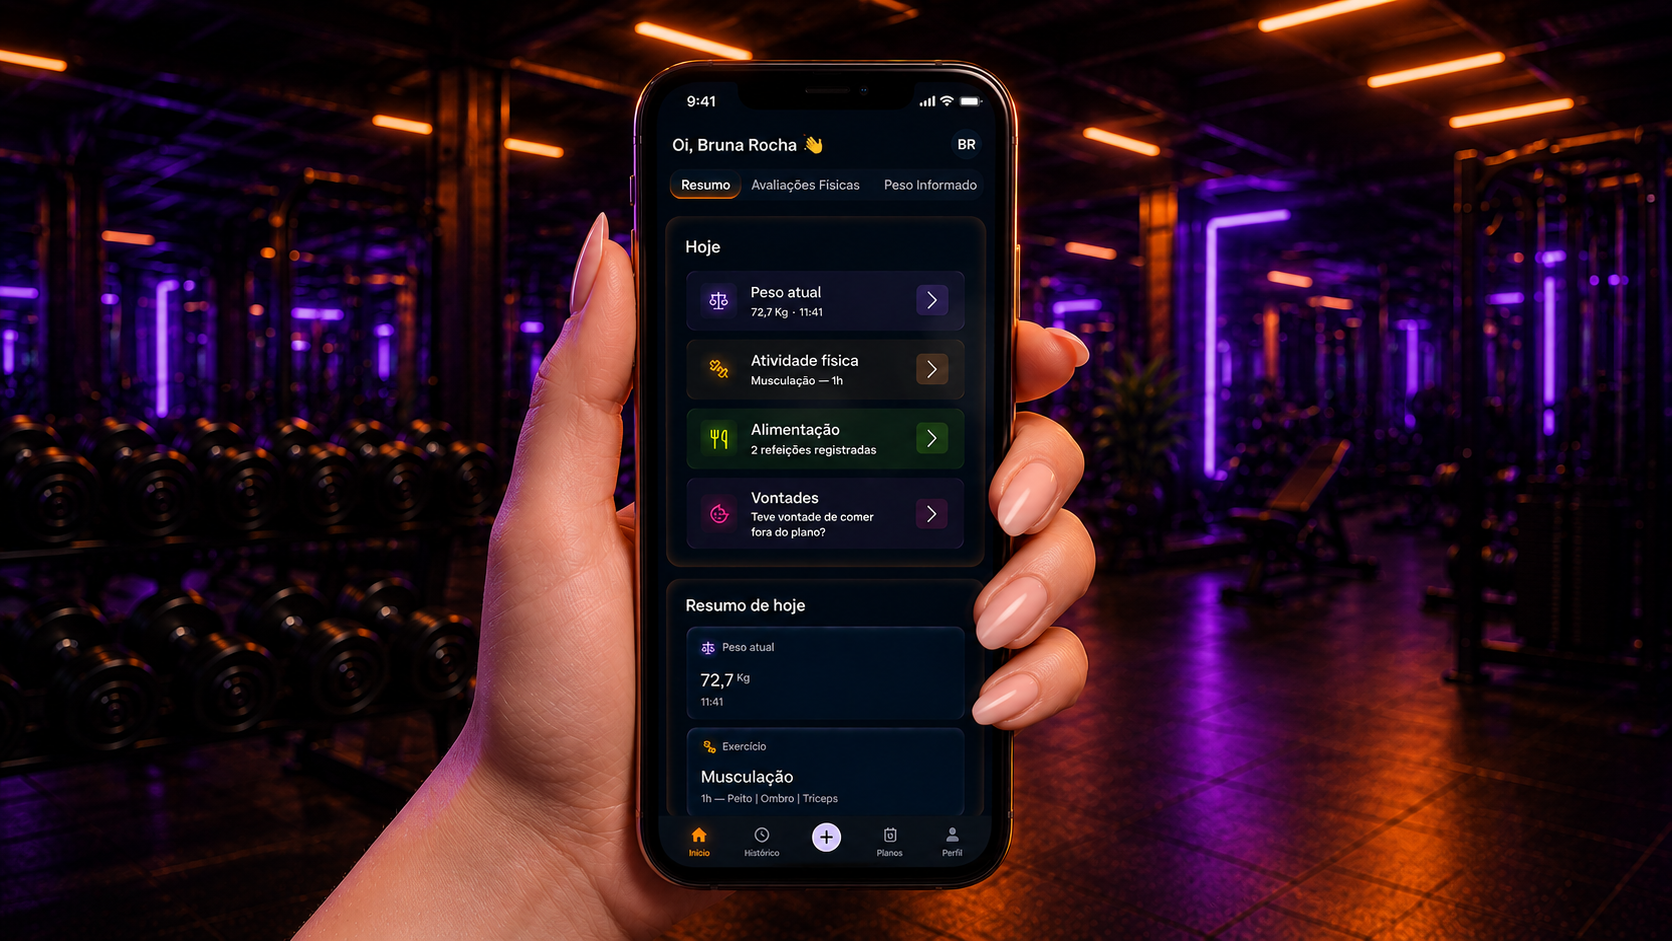
Person exploring the health tracking app
02

The First Concept

The first version of the project was intentionally small. Instead of designing every possible feature, I focused on a dashboard capable of answering a single, simple question.

“How am I doing today?”

Each action could be completed through lightweight modal windows, allowing users to register information without leaving the dashboard.

At this stage, the experience was designed manually in Figma before any AI-assisted development began.

The initial concept included
  • today’s weight
  • physical activity
  • meals
  • latest body assessment
03

Design Approach

Rather than creating every UI component from scratch, I chose to build the interface using the shadcn/ui component library as a foundation.

This decision allowed me to
  • 01Focus on solving UX problems instead of recreating common interface patterns
  • 02Maintain consistency across the application
  • 03Accelerate implementation while keeping a high-quality UI foundation
04

AI-assisted Prototyping

After defining the product structure, I used AI-assisted development through Figma Make to rapidly transform concepts into functional prototypes.

AI was responsible for accelerating implementation — not for making design decisions.

I designed
  • Product vision
  • UX decisions
  • User flows
  • Information architecture
  • Prioritization
  • Feature evolution
AI accelerated
  • Functional prototype
  • Rapid iterations
  • Interaction implementation
05

Product Iterations

Once the first functional prototype was available, new usability issues quickly emerged — so I continuously evolved the product.
Iteration 01

Recording Weight Was Not Enough

The original version allowed users to register their current weight. However, during everyday use, I realized that weight alone rarely communicates meaningful progress — people often lose body fat without significant changes on the scale.

Design decision

Weight entries evolved into richer progress records — turning isolated measurements into a chronological history.

  • measurement date
  • time
  • fasting status
  • optional notes
  • progress photos
  • historical visualization
Iteration 02

Eliminating Repetitive Inputs

Users had to repeatedly enter information that never changes, such as gender.

Design decision

I centralized permanent user information in a dedicated profile. Biological sex is now collected only once during onboarding and automatically reused whenever needed — enabling the app to select the appropriate anthropometric formulas for each user and improving calculation accuracy.

Iteration 03

Cravings Don’t Always Become Actions

Following a nutrition plan isn’t only about recording meals. Moments of temptation often provide valuable context for understanding adherence.

Design decision

I created a Cravings feature so users can record each craving episode. Over time this contextual data reveals recurring patterns — enabling more productive conversations with a nutritionist.

  • the time it occurred
  • whether the craving was for sweet or savory foods
  • optional notes describing how they were feeling
Iteration 04

Understanding Behavior Beyond Metrics

Looking at isolated meal logs makes it difficult to identify recurring behaviors or have productive discussions during nutritional follow-up.

Design decision

I designed an automated nutrition adherence report that transforms daily meal records into a structured overview of eating habits — helping users and nutritionists identify recurring behaviors and make informed adjustments.

  • overall adherence to the nutrition plan
  • planned and unplanned meals
  • meals that most frequently deviated from the plan
  • time of day when unplanned meals occurred most often
  • recurring craving patterns
  • sweet versus savory cravings
Iteration 05

Looking Beyond the Scale

Weight is one of the most commonly tracked health metrics, but it rarely tells the whole story.

Design decision

I designed a dedicated Physical Assessment module to provide a more complete picture of body evolution through anthropometric measurements and body composition analysis. Each assessment is stored historically, allowing users to compare evaluations over time.

  • body fat percentage
  • lean body mass
  • circumferences
  • skinfold measurements
  • BMI
  • waist-to-hip ratio
  • basal metabolic rate
  • other anthropometric indicators calculated automatically
06

Try the Product

You can try the latest version here

The prototype is fully interactive. Feel free to explore the flows, test the interactions and experience the product like a real user would.

07

Next Steps

The next iterations will focus on turning historical data into more meaningful, personalized insights.

  1. 01

    Replace the current placeholder illustration on the dashboard with a personalized representation of the user.

  2. 02

    Expanded anthropometric analysis.

  3. 03

    Personalize the application based on user profile information, including gender-specific copy and selectable communication tone.

  4. 04

    Move beyond historical charts by automatically identifying meaningful trends — periods of greatest progress, plateaus, changes in adherence and improvements in body composition over time.

  5. 05

    Generate contextual suggestions based on user history, helping users identify opportunities for improvement without replacing professional guidance.

  6. 06

    Use historical records — meals, cravings, physical activity and body assessments — to identify recurring behavioral patterns and anticipate moments where users are more likely to struggle with adherence.

08

Reflection

What started as a personal project eventually became a valuable product design exercise.

Unlike client projects, where requirements often exist upfront, this product evolved through continuous observation, experimentation and iteration. Every new feature emerged from a real usability problem discovered while using the application, making each design decision directly connected to an actual user need.

This experience reinforced something I strongly believe about product design: the goal isn’t to build more features, but to reduce friction and make information more meaningful. Sometimes that means automating calculations. Sometimes it means removing redundant inputs. And sometimes it simply means presenting existing data in a way that helps users recognize patterns they couldn’t see before.

Because I owned the product from concept to implementation, this project also gave me the opportunity to work across areas I don’t always explore as deeply in client projects — data modeling, persistence strategies, information architecture, behavioral design and AI-assisted prototyping. That end-to-end ownership gave me a broader perspective on product design and reinforced the importance of connecting user experience with technical and product decisions from the very beginning.
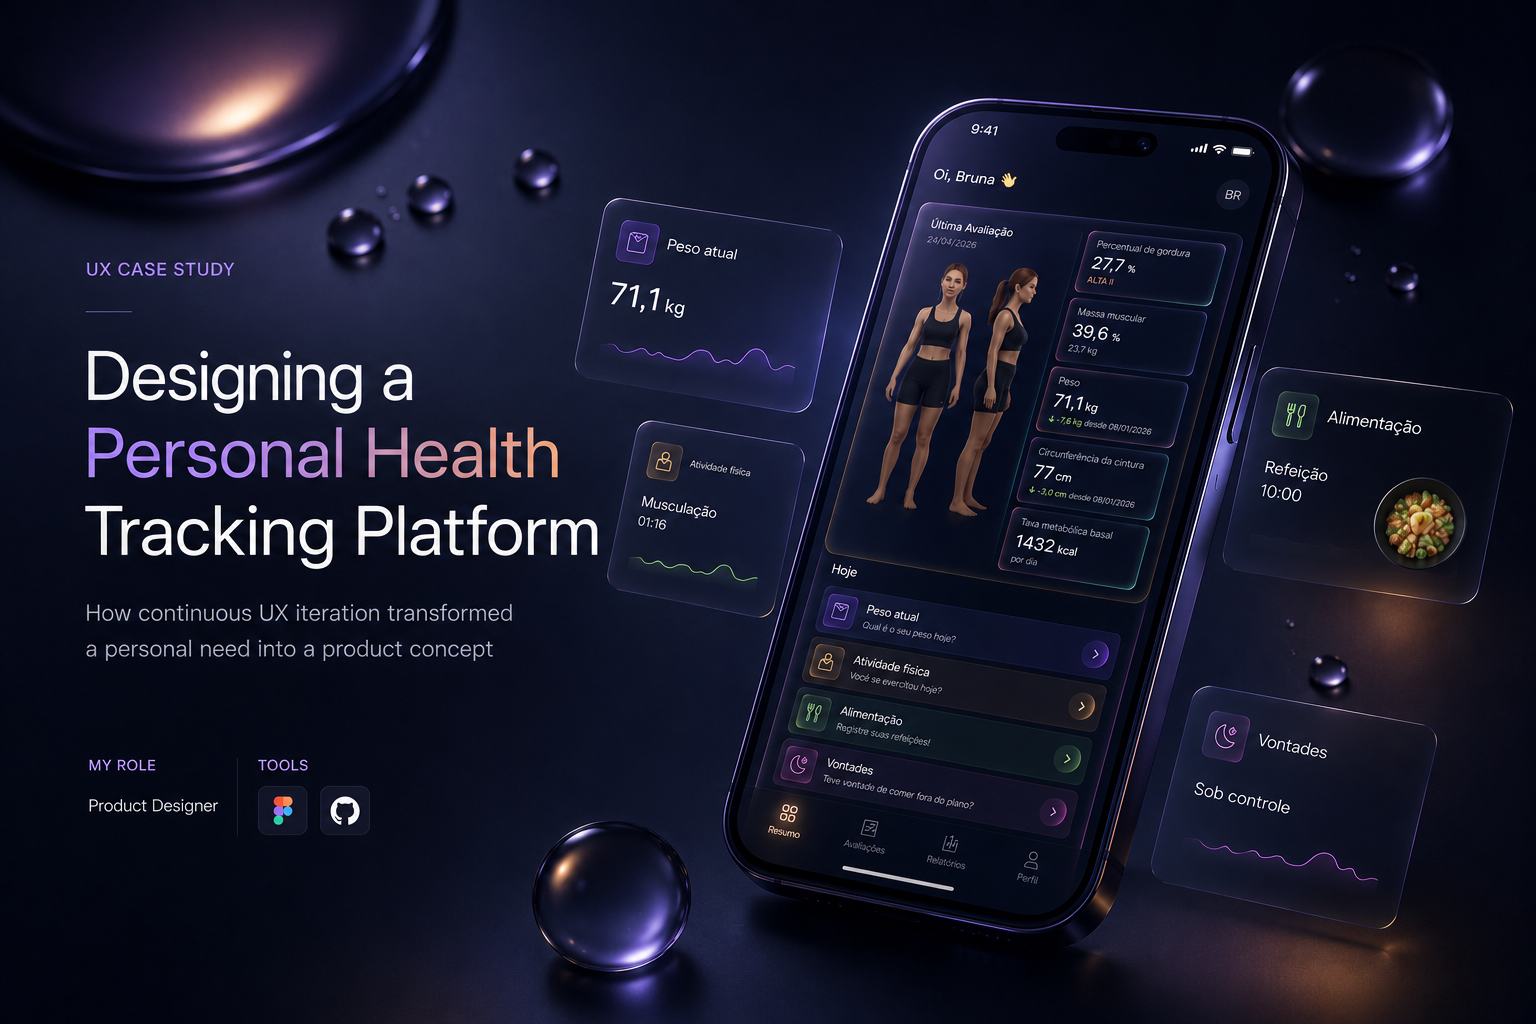

Health tracking app in context

Interested in working together?